
Hello I’m trying to run the code of Question 4 in the Sandbox notebook but it takes to much time, I can’t see any plot. I haven’t install the library plotly in my local computer any suggestion?
Are you sure to be running the snippet provided in Question 4? It reads the results from randomized_search_results.csv, which should be fast.
If you run the 500 iterations it may indeed take a long time.
Yes, I am running the snipped code of Question 4. The problem occurs when I try to select the region from 0 to 0.8 in the mean_test_score axis. I get a message error.
Do you have the same problem when running the snippet in any notebook other than the sandbox?
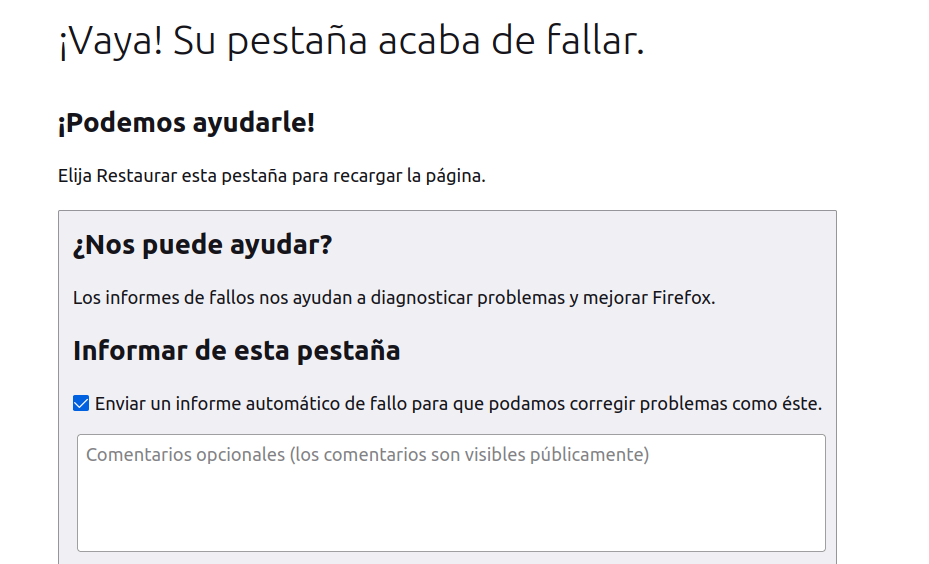
Could you also try with another browser?
I will try with another browser because I haven’t install the the library in my computer. Thanks