
The 12th question asks:
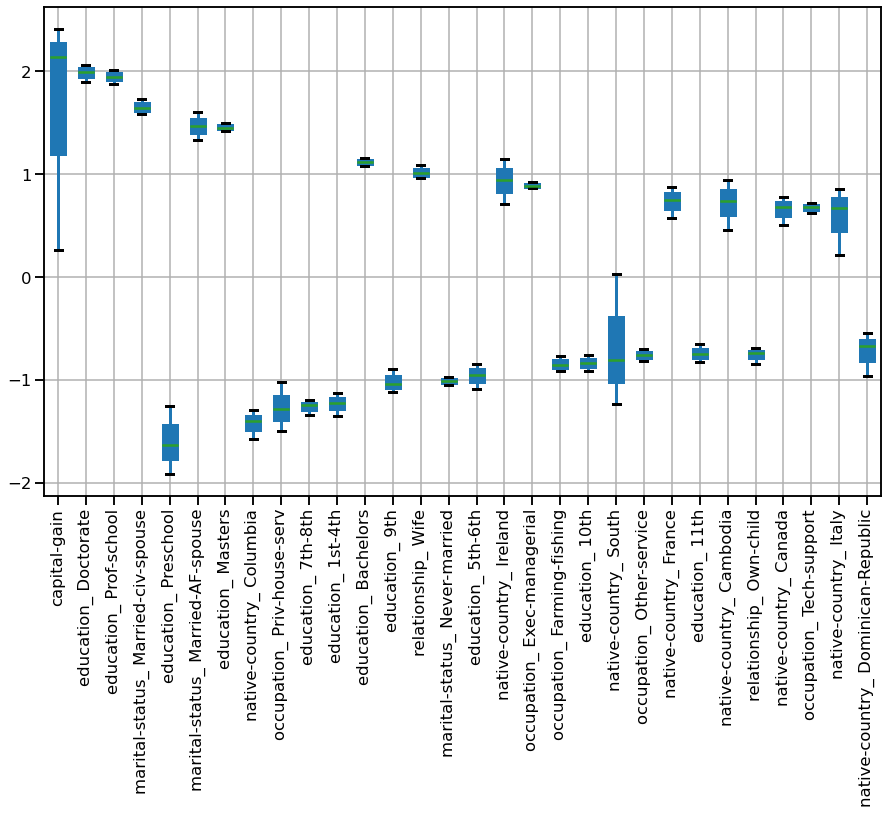
Which of the following pair of features is most impacting the predictions of the logistic regression classifier based on the relative magnitude of its coefficients?
I tried to plot the box plot in this manner.
coefs = [est[-1].coef_[0] for est in cv_res3['estimator']]
coefs = pd.DataFrame(coefs, columns=feature_names)
coefs = coefs.describe().loc[["min", "max", "mean"]]
coefs_t = coefs.T
coefs_t["mean_abs"] = coefs_t["mean"].abs()
coefs_t.sort_values(by="mean_abs", ascending=False, inplace=True)
coefs_t.head(30).T.loc[["min", "max", "mean"]].boxplot(figsize=(15, 9))
_ = plt.xticks(rotation=90)
Is-it correct?