
Hi,
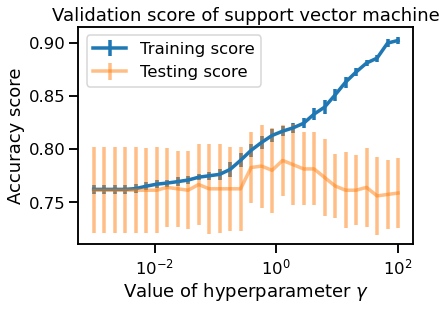
in solution when validation curve of SVM is plotted some people could believe than there are no standard deviations for training scores for gammas <1 because on the graph these std are hidded by the testing scores’ ones. Adding transparency to the graph with the alpha parameter fix it:
plt.errorbar(gamma_param, train_scores.mean(axis=1),
             yerr=train_scores.std(axis=1), label='Training score')
plt.errorbar(gamma_param, test_scores.mean(axis=1),
             yerr=test_scores.std(axis=1), label='Testing score', alpha = 0.5)
plt.legend()

plt.xscale("log")
plt.xlabel(r"Value of hyperparameter $\gamma$")
plt.ylabel("Accuracy score")
_ = plt.title("Validation score of support vector machine")
The same commentary can be applied to the learning curves 