How to choose best plot option

When I have to plot something I always wonder which tool is to be used.
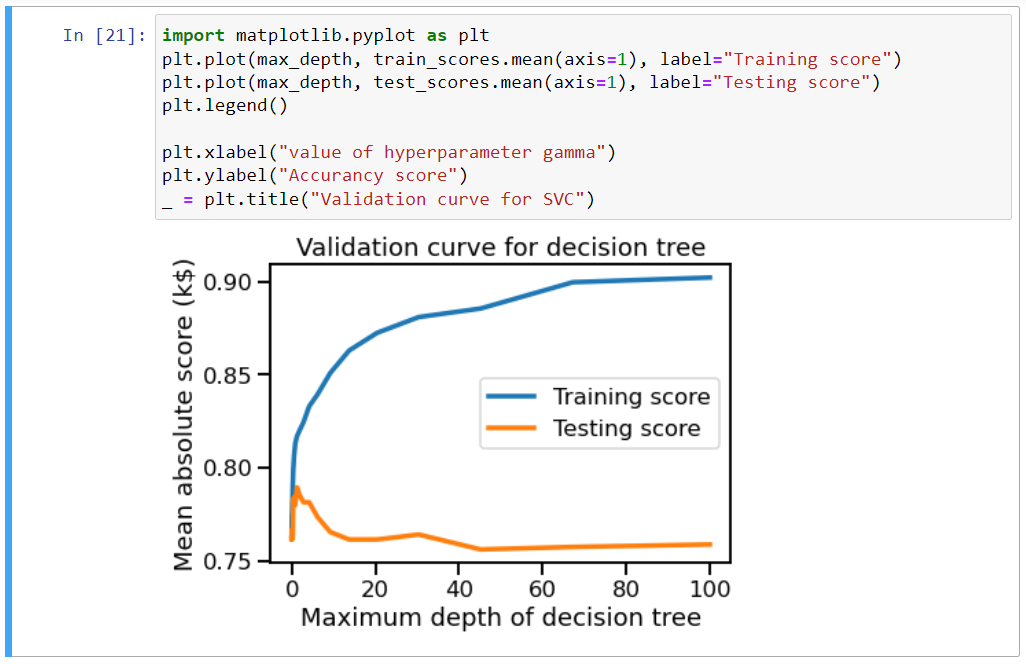
In this exercise I used the plot function and I noticed there was a local maximum, but it was hard to understand the relevant values due of the form of the graph.
Is there any way to have an interactive graph that will return the (x,y) values pointing with the mouse?
Or is there a way to se a zoom for some specific area?

Here is my plot:

If you look at the Solution notebook located between the jupyter notebook and the page’s forum (you will have to click on Solution > Look at the solution: to display it), we propose using a logaritmic scale for the x-axis. This can be done using plt.xscale("log"). If you prefer doing a zoom to a certain region, you can change the x-axis range with plt.xlim([0, 20]), but keep in mind you may need adding extra points to have a good description of the zoomed-in region.

4 Likes