
Hi!, I’m face some issues when try pairplot example, in the notebook. Please, can someone help me ?
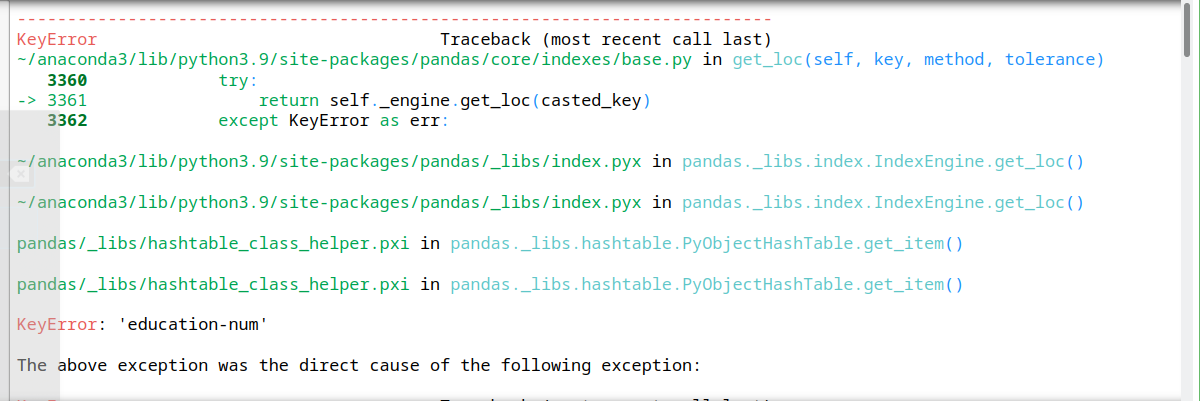
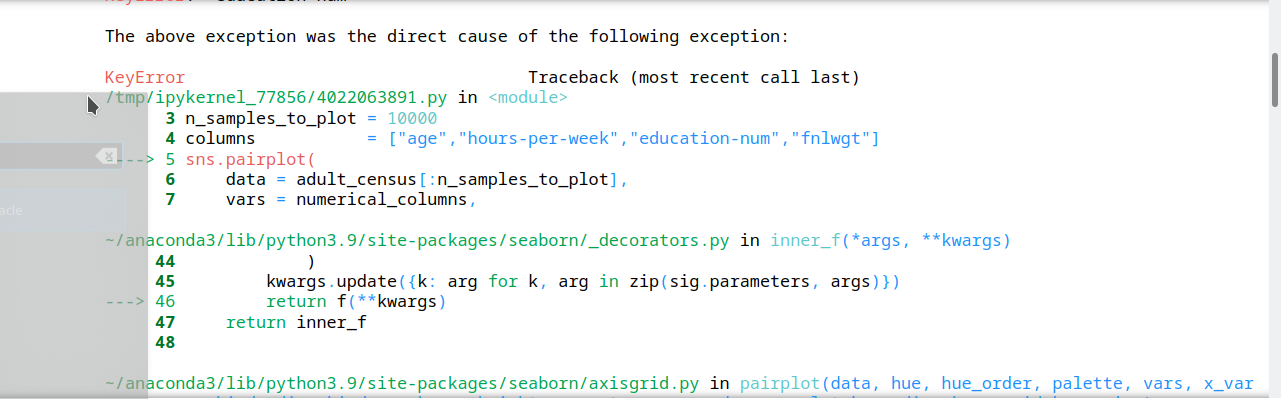
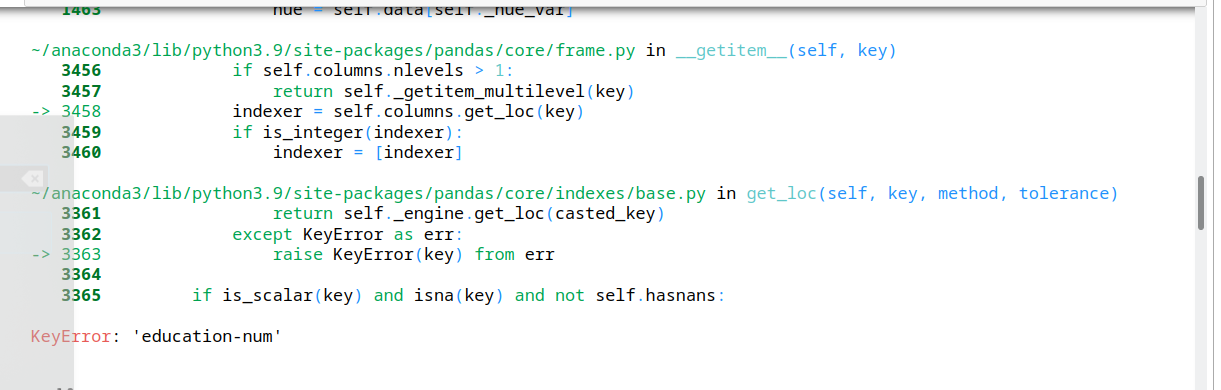
The error mentioned that you are requested "education-num" (it should be in the list numerical_columns) while it is not a column available in adult_census.
On the version of this notebook in FUN, at this cell I have the following columns:
>>> adult_census.columns

Index(['age', 'education-num', 'capital-gain', 'capital-loss',
       'hours-per-week', 'workclass', 'education', 'marital-status',
       'occupation', 'relationship', 'race', 'sex', 'native-country', 'class'],
      dtype='object')
So "education-num" is present in the columns of the dataframe unlike in your case.
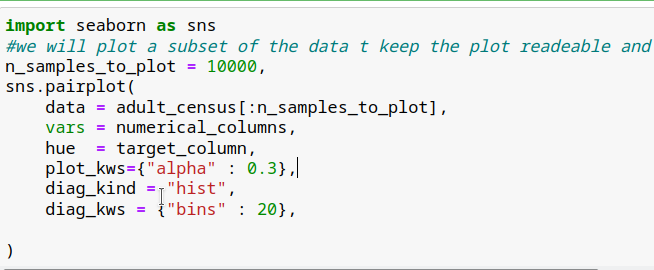
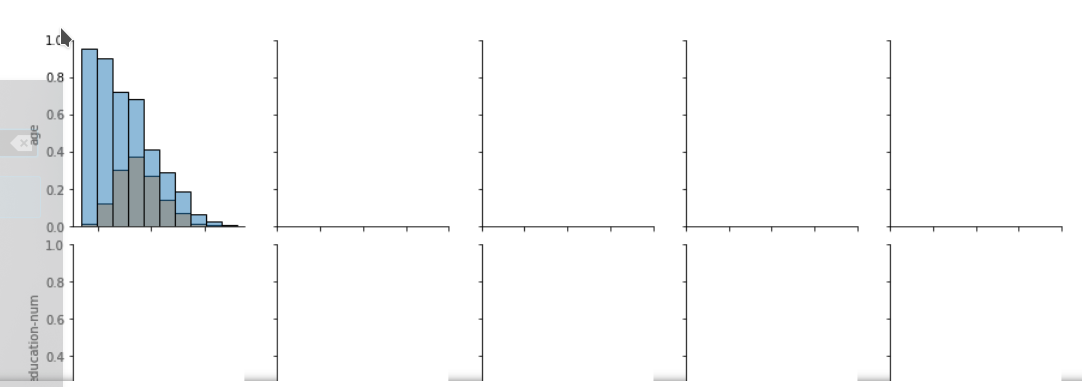
I also have a different cell for plotting the pairplot:
# We will plot a subset of the data to keep the plot readable and make the
# plotting faster
n_samples_to_plot = 5000
columns = ["age", "education-num", "hours-per-week"]
_ = sns.pairplot(
    data=adult_census[:n_samples_to_plot],
    vars=columns,
    hue=target_column,
    plot_kws={"alpha": 0.2},
    height=3,
    diag_kind="hist",
    diag_kws={"bins": 30},
)
Indeed, we use columns instead of numerical_columns.
Ok. Thanks, for your feedbacks.