
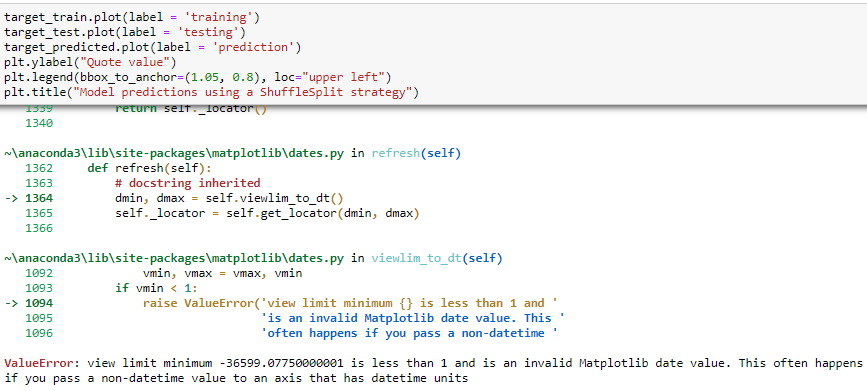
Hi,
I encountered this error when plotting the target_prediction. How could I solve this?
Thank you
It does not make sense to plot the target_train and target_test in the same figure because they do not share the same x axis (as they do not have the same number of elements and do not represent the same dates).
Try plotting those in different notebook cells.
Hi it works in the workbook titled ’ Non i.i.d. data’ though?
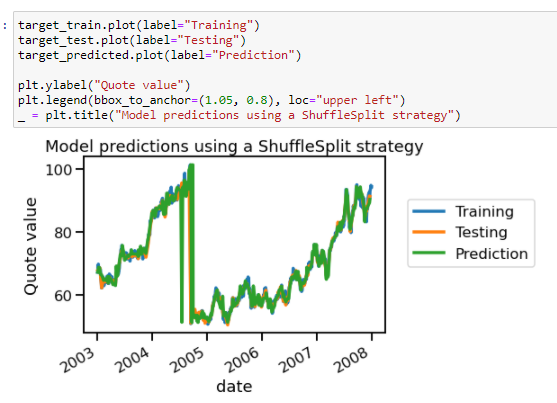
Indeed I understand the source of confusion now. In the “Non i.i.d. data” notebook, target_train, target_test and target_predicted are three pandas Series with overlapping time spans as index for the x axis of the figure. This is probably not the case in your cell.
You can introspect the index of a pandas Series or DataFrame by typing:
target_train.index
target_test.index
target_predicted.index
in 3 different cells of your notebook to understand what’s going on.
This question reveals a problem in the way we implicitly use indexes for plotting in the non-i.i.d. notebook.
We might want to reconsider this to avoid introducing complexity related to pandas indices on top of the complexity of the main message of this module which is a bout CV strategies.