
Hi,
The idea of nested cross validation is simple, but I had some trouble to grasp which part of the data set is used at which step.
My suggestion would be to either show a bar diagram with the folds in each of training, validation and testing splits or, alternatively, to show the explicit algorithm of how these data set splits are created and used.
Thank you,
Edgar
1 Like
Yes, a diagram to illustrate the concept would be a good idea. We will take this advice and add it to the next version of the MOOC.
1 Like
I guess a figure similar to this one:
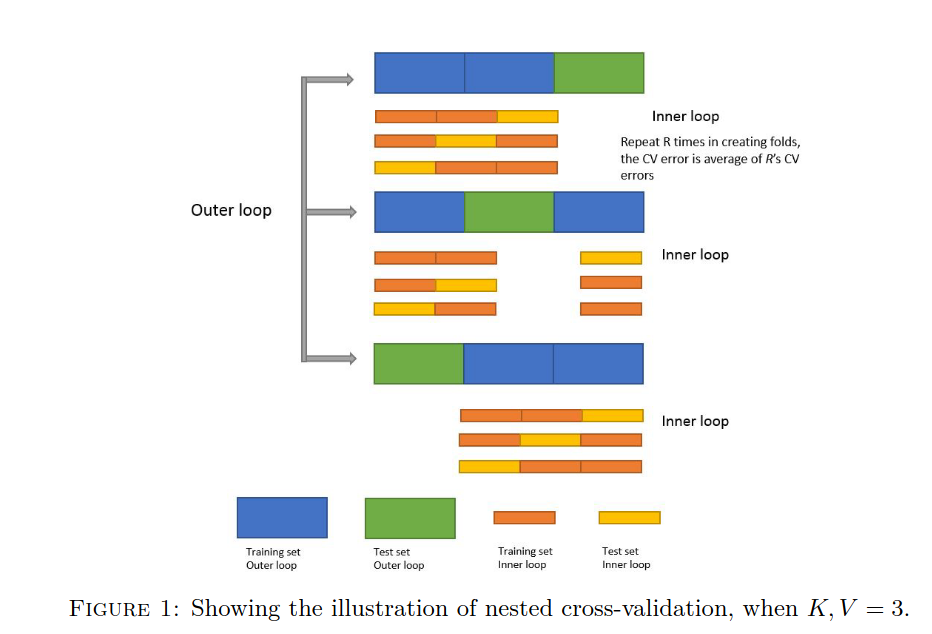
Source: http://www.scielo.org.co/pdf/rce/v43n1/0120-1751-rce-43-01-103.pdf
4 Likes
Yes, exactly, I was looking for something like this one!
Thank you very much for your response,
Edgar
Hello,
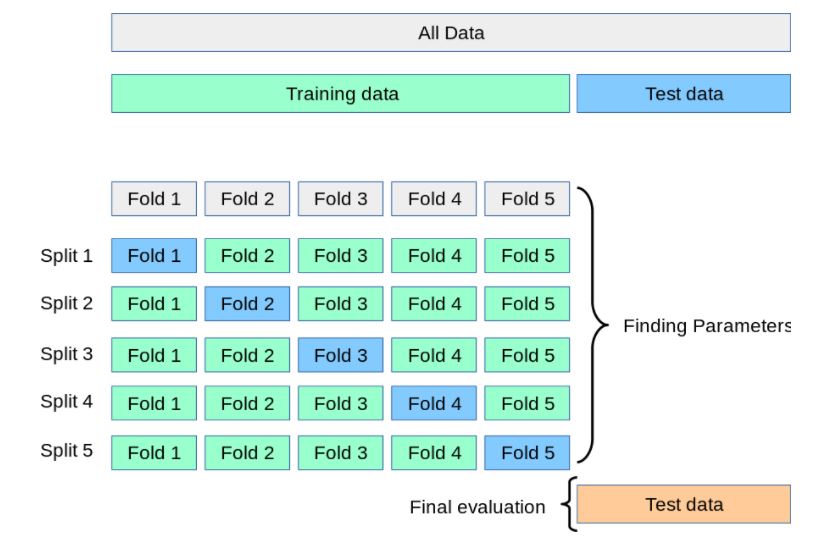
For me, the illustration that helped me a lot to understand the concepts of inner/outer cv is the one provided in the scikit-learn documentation
3.1. Cross-validation: evaluating estimator performance — scikit-learn 0.24.2 documentation
I thank you again for all your explanations 
3 Likes
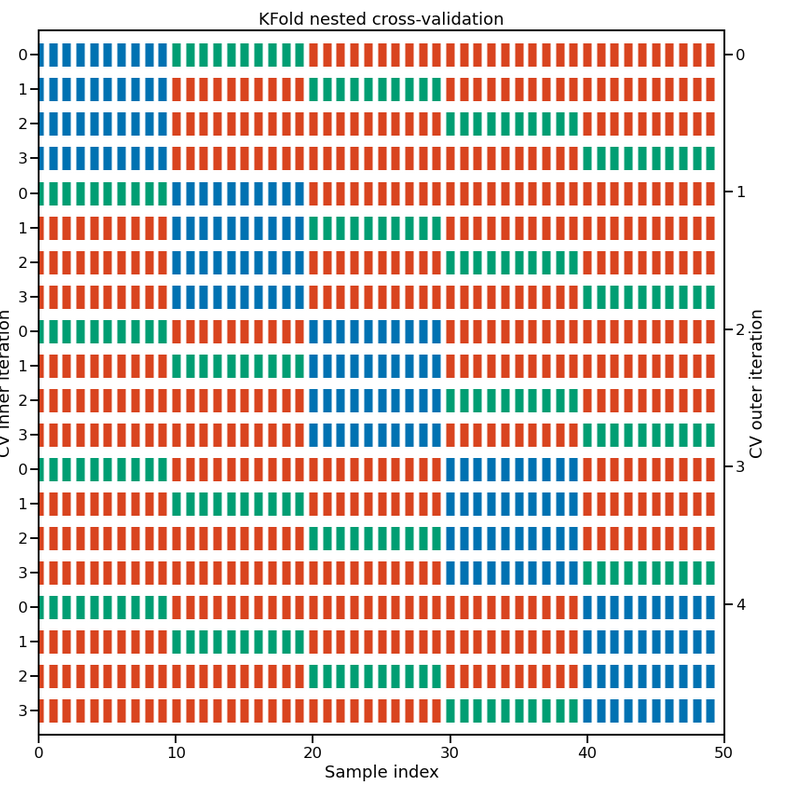
We have a plot now, this can be improved further but good enough for now … Evaluation and hyperparameter tuning — Scikit-learn course
I have marked my answer as “solution” since you can not mark a whisper as solution (the whisper is not public …)