Hi,
The questions are related to log transformations used in parameter_tuning_randomized_search notebook.
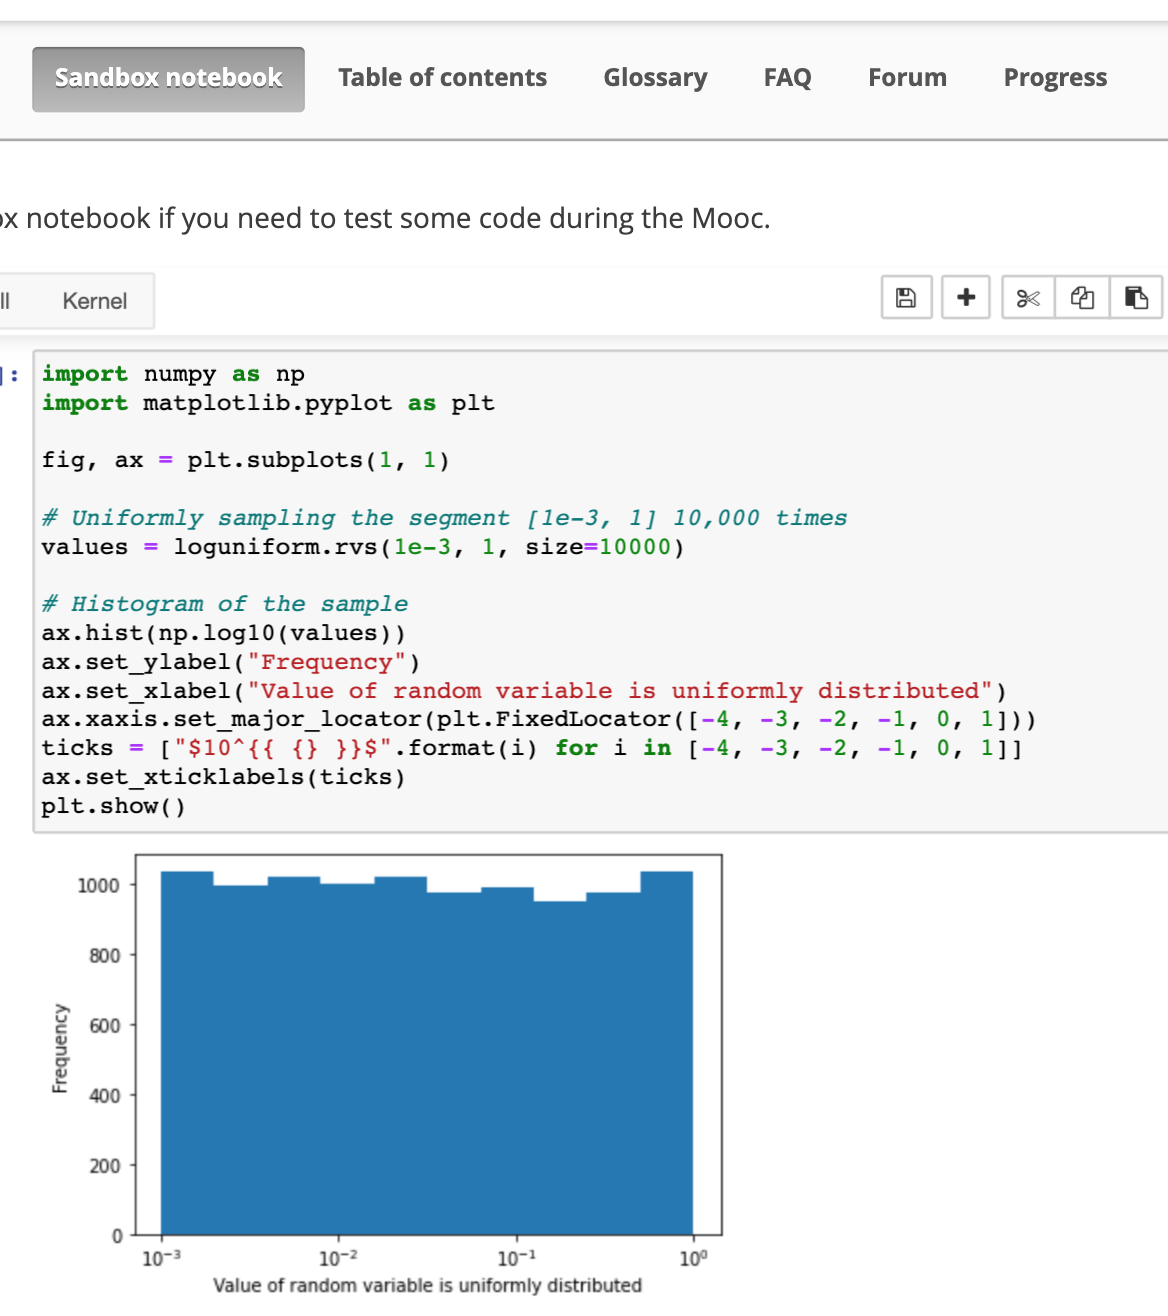
I know that we have specified the range while using the loguniform function but I want to print the values that lie in the range mentioned. How should I proceed ?
param_distributions = {
‘classifier__l2_regularization’: loguniform(1e-6, 1e3),
‘classifier__learning_rate’: loguniform(0.001, 10),
‘classifier__max_leaf_nodes’: loguniform_int(2, 256),
‘classifier__min_samples_leaf’: loguniform_int(1, 100),
‘classifier__max_bins’: loguniform_int(2, 255),
}
How do I know if I need to use log to the base 10 or log to the base 2 for different hyperparameters?
fig = px.parallel_coordinates(
cv_results.rename(shorten_param, axis=1).apply({
“learning_rate”: np.log10,
“max_leaf_nodes”: np.log2,
“max_bins”: np.log2,
“min_samples_leaf”: np.log10,
“l2_regularization”: np.log10,
“mean_test_score”: lambda x: x}),
color=“mean_test_score”,
color_continuous_scale=px.colors.sequential.Viridis,
)
Thanks in advance!