
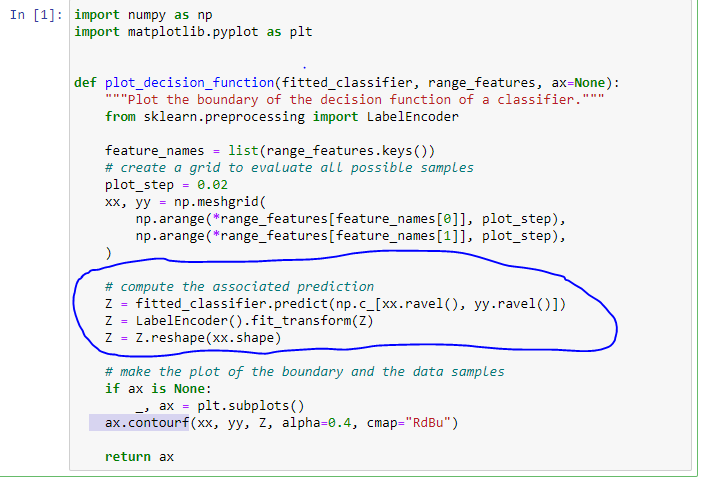
most of the functions’ lines are quite clear except the highlighted part, it needs some clarification to understand it
I also had some issues understanding these 3 lines of code, as I don’t know Python. The following helped me get a sense of what’s going on here. In a nutshell, a lot of compact plumbing to:
-
standardize a variable (as in StandardScaler) by removing the mean and scaling to a variance of 1, as in Z = (x - mean(x)) / std(x)
-
encode labels / categories / classes to numerical values (when the function will be later called with LogisticRegression, there will be two values returned, 0 and 1)
-
Then the matplotlib contourf() function does its job
Just to comment only on the three lines:
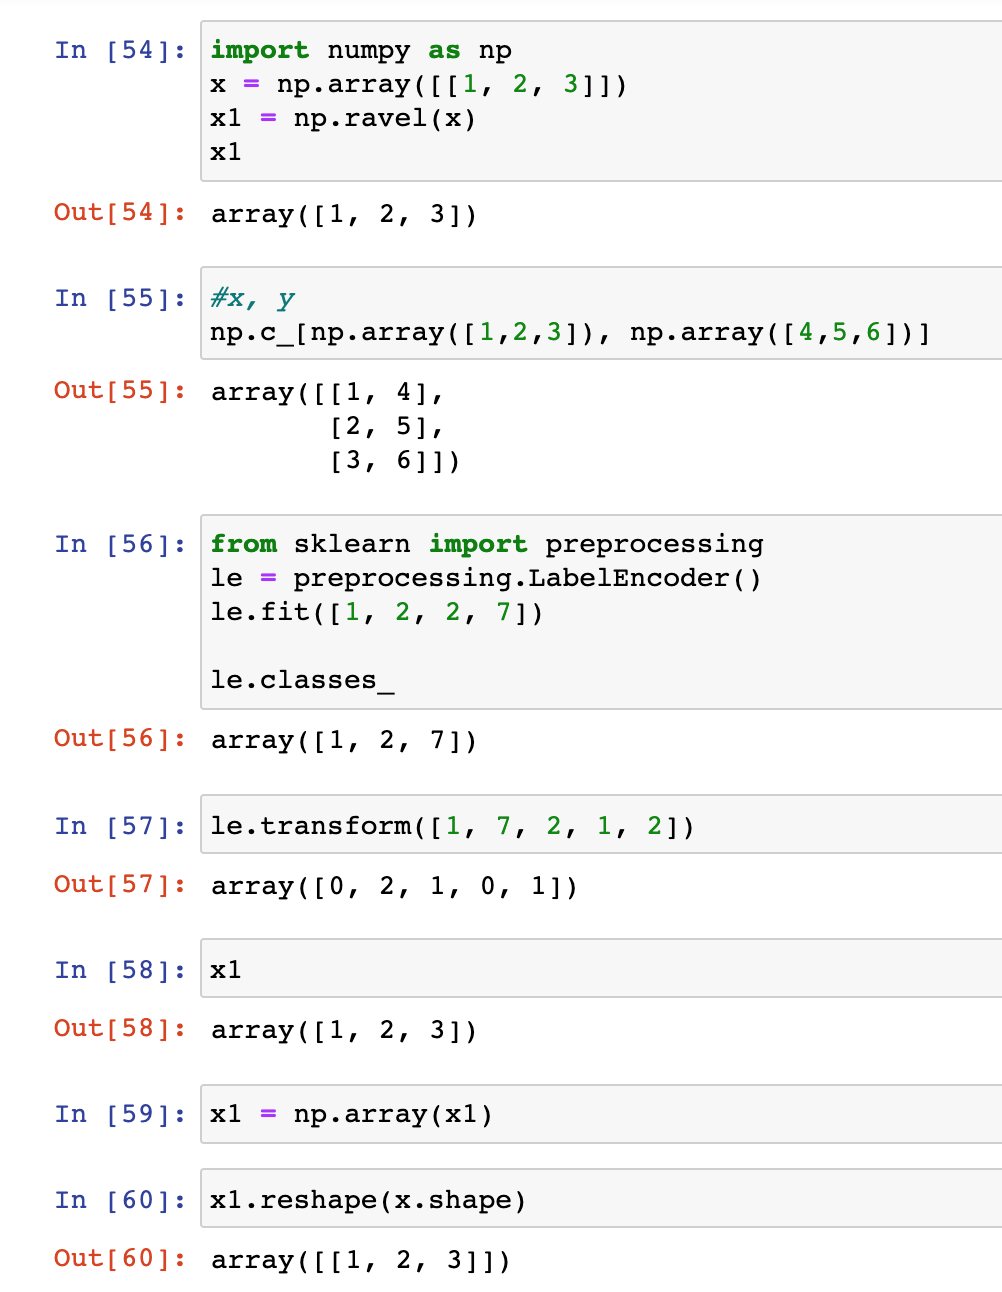
- The first line of code allows predicting on all possible locations of the 2D space.
np.c_is used to concatenate while.ravel()is used to transform the 2D matrix into a 1D vector. The purpose here is to get a 2D matrix with two columns (xxandyy) where the number of lines corresponds to the number of point on the 2D grid (generate bymeshgrid) - The second line makes sure that the label is starting from 0 until the number of classes (it will be used for the color in matplotlib)
- The last line is to reshape the predictions to shape of the
meshgrid.
1 Like
How do we know the output of the meshgrid, xx and yy is a 2 D array but based on the meshgrid function it does not put 2 square bracket.
create a grid to evaluate all possible samples
plot_step = 0.02
xx, yy = np.meshgrid(
np.arange(*range_features[feature_names[0]], plot_step),
np.arange(*range_features[feature_names[1]], plot_step),
)
Last question regarding array also. Why do we need to take the last regressor and first coefficient value? I tried to change the slicing value but it resulted an error.
coefs = logistic_regression[-1].coef_[0] # the coefficients is a 2d array
weights = pd.Series(coefs, index=culmen_columns)
coefs to be a pandas series is expected to be a 1d array. However, this is a 2d array of shape (n_features, 1). So [0] allows getting a 1darray of shape (n_features,)
The coefficient is the weights that become series after apply pd.Series.
Ok, I get the idea od series is a 1 dimensional array (n_feature,)
However, I still cannot understand how to identify it is a 2d array for the coefficient. Can you explain a bit?
Why we need to take the last element of the model ( logistic_regression[-1])?
logistic_regression[-1].coef_.shape
will return something like (n_features, 1) which means it is 2-dimensional.
You could also use
logistic_regression[-1].coef_.ndim
That will tell you 2.
I assume that logistic_regression is a pipeline. Thus [-1] corresponds to the LogisticRegression that contains the coef_.
2 Likes