Problem with dataframe.plot.box => i obtain circles and not boxes

Hi,
something weird is hapening since I’m obtaining circles and not boxes as a results of dataframe.plot.box.
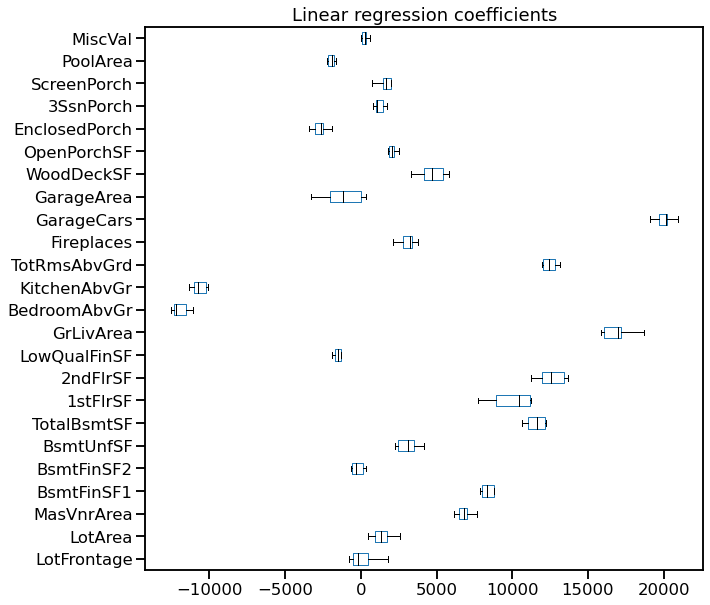
First I used that code :

import pandas as pd
import matplotlib.pyplot as plt
coefs = [est[-1].coef_ for est in cv_results["estimator"]]
color = {"whiskers": "black", "medians": "black", "caps": "black"}
weights_linear_regression.plot.box(color=color, vert=False, figsize=(10,10))
_ = plt.title("Linear regression coefficients")

And i obtained circle in place of boxes :

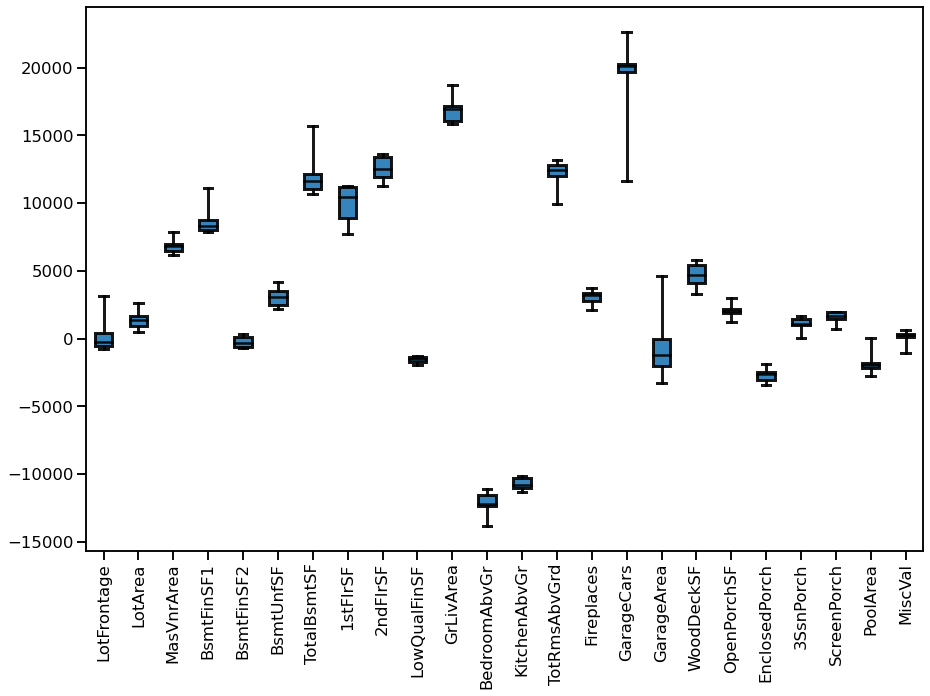
I noticed you used slightly different argument for dataframe.plot.box in solution so I tried :

import seaborn as sns
sns.set_context("talk")
# Define the style of the box style
boxplot_property = {
    "vert": True,
    "whis": 100,
    "patch_artist": True,
    "widths": 0.5,
    "rot": 90,
    "boxprops": dict(linewidth=3, color="black", alpha=0.9),
    "medianprops": dict(linewidth=2.5, color="black", alpha=0.9),
    "whiskerprops": dict(linewidth=3, color="black", alpha=0.9),
    "capprops": dict(linewidth=3, color="black", alpha=0.9),
}

_, ax = plt.subplots(figsize=(15, 10))
_ = weights_linear_regression.plot.box(**boxplot_property, ax=ax)

but the result was worse :

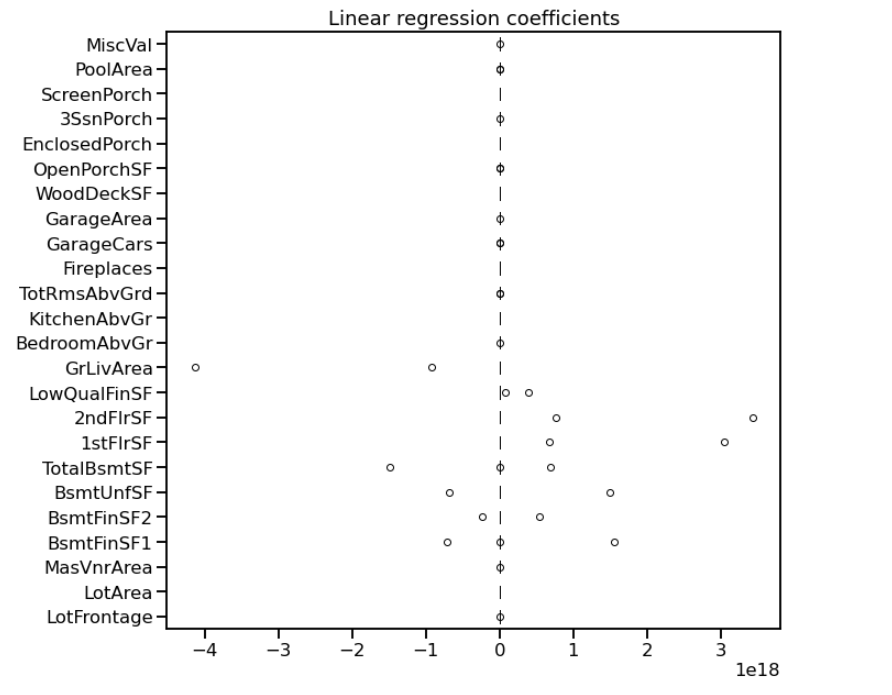
SO I m very puzzled : Why I do not obtain boxes???

I also tested the full code of teh solution in the sandbox and I still have circles in place of boxes…

I found the solution :
the problem is that outliers are hiding the whiskers so the solution is adding showfliers = False in the arguments of the plots

import matplotlib.pyplot as plt

color = {"whiskers": "black", "medians": "black", "caps": "black"}
weights_linear_regression.plot.box(color=color, vert=False, figsize=(10,10), showfliers = False)
_ = plt.title("Linear regression coefficients")

or :

import seaborn as sns
sns.set_context("talk")
# Define the style of the box style
boxplot_property = {
    "vert": True,
    "whis": 100,
    "patch_artist": True,
    "widths": 0.5,
    "rot": 90,
    "boxprops": dict(linewidth=3, color="black", alpha=0.9),
    "medianprops": dict(linewidth=2.5, color="black", alpha=0.9),
    "whiskerprops": dict(linewidth=3, color="black", alpha=0.9),
    "capprops": dict(linewidth=3, color="black", alpha=0.9),
    "showfliers" : False,
}

_, ax = plt.subplots(figsize=(15, 10))
_ = weights_linear_regression.plot.box(**boxplot_property, ax=ax)

but the problem is that we are losing the idea of the extrems values.
Perhaps here whiskers are not the better method to answer the questions 1 and 2…

Another possibility is to increase this value.