In section:
Section: Fitting a scikit-learn model on numerical data.
sub-section:
Preprocessing for numerical features
can we add this option:
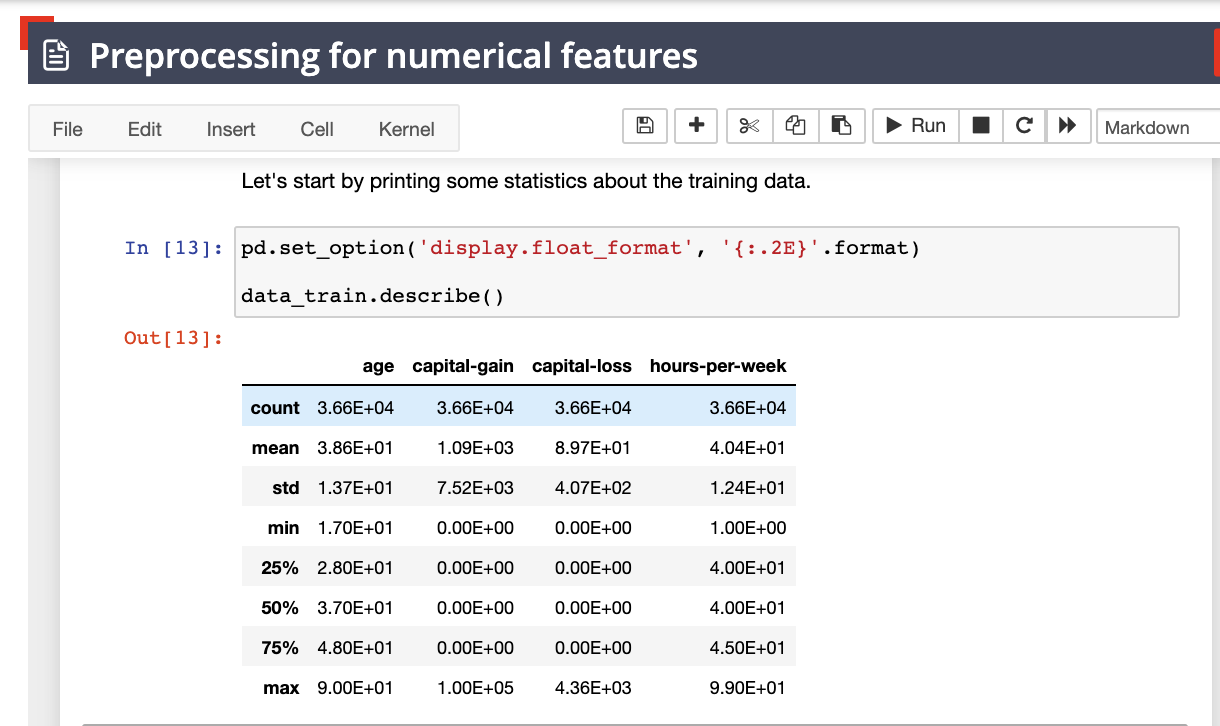
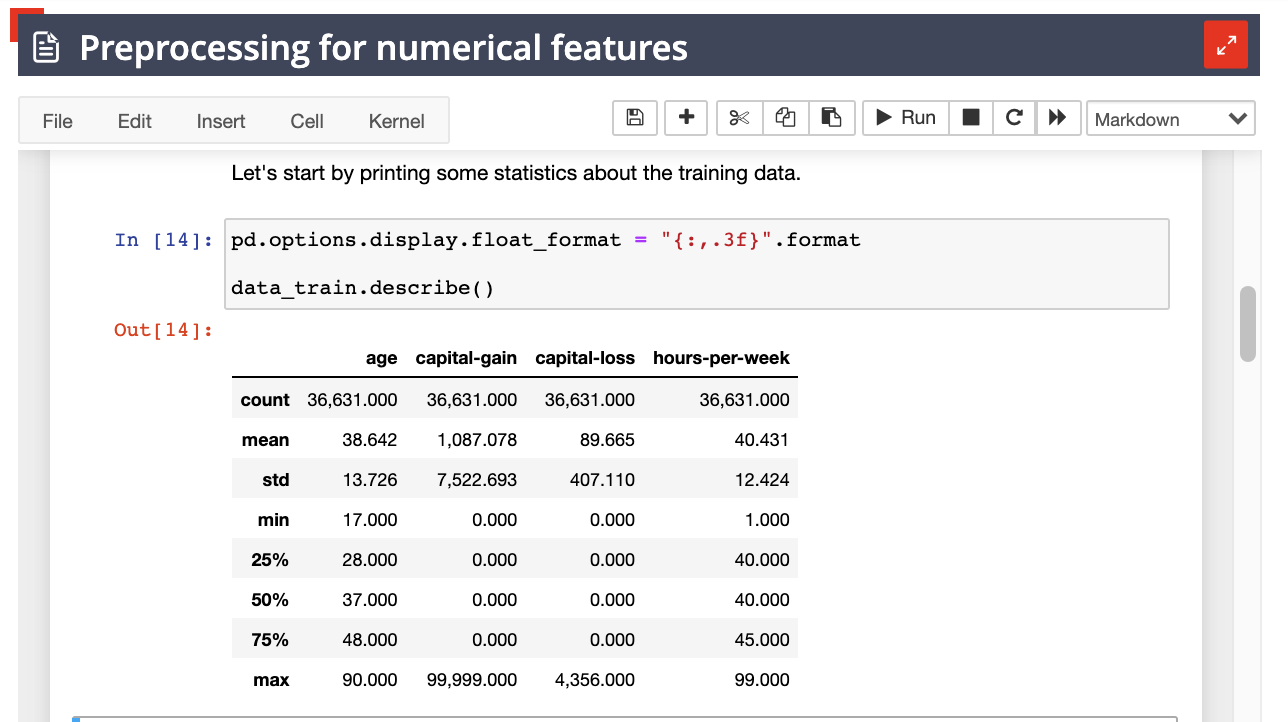
rounding numbers for output of .describe() function
pd.options.display.float_format = "{:,.3f}".format

In section:
Section: Fitting a scikit-learn model on numerical data.
sub-section:
can we add this option:
rounding numbers for output of .describe() function
pd.options.display.float_format = "{:,.3f}".format
I am not in favour of adding this code. The reason is that we made an effort to remove any unnecessary code that tweaks pandas, matplotlib, NumPy behaviour because it could be intimidating for beginners.
In materials where we would put a strong knowledge in NumPy / pandas as a requirement, I would certainly take the advice.
Got it.
I’ve personally found it difficult to read numbers when they are output in scientific notation like that.
But, I understand the reasoning here.
Another possibility would be to have an rc file without to have to write code.
For this MOOC session it might be difficult but we should certainly look at this option for the next session.
Not sure what an rc file is. But, I think that if I can’t easily know what the count is from the .describe() function, then it’s not so useful. Even though it is the default, I cannot read those numbers and make sense of them. 
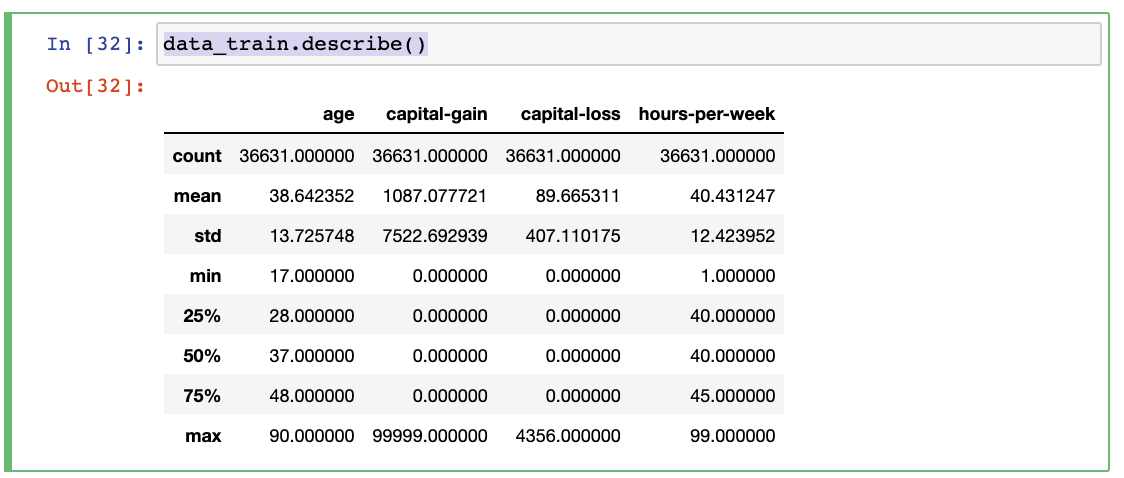
Uhm there is something weird here still. Executing the notebook on FUN without tweaking anything, I am getting the following output by default.
        	age 	    capital-gain 	capital-loss 	hours-per-week
count 	36631.000000 	36631.000000 	36631.000000 	36631.000000
mean 	38.642352 	    1087.077721 	89.665311 	    4 0.431247
std 	13.725748 	    7522.692939 	407.110175 	    12.423952
min 	17.000000 	    0.000000 	    0.000000 	    1.000000
25% 	28.000000 	    0.000000 	    0.000000 	    40.000000
50% 	37.000000 	    0.000000 	    0.000000 	    40.000000
75% 	48.000000 	    0.000000 	    0.000000 	    45.000000
max 	90.000000 	    99999.000000 	4356.000000 	99.000000
No, when I first ran the notebook, it gave me scientific notation.
Not sure why we are getting a different view, by default.
I assume I can only change my own notebook, right? I shouldn’t be able to change the main notebook in the MOOC.
From the FUN interface, you are indeed only modifying your own notebook. We are committing changes here: GitHub - INRIA/scikit-learn-mooc: scikit-learn-mooc
The python_scripts contains all the lectures indeed. Apart of the quizzes, we are making changing that will have a direct effect on FUN, once one is reverting the notebook to original.
In section “Preprocessing for Numerical Features”, after resetting the notebook to original and running the notebook from the very top cell:
this code data_train.describe(), I see this:
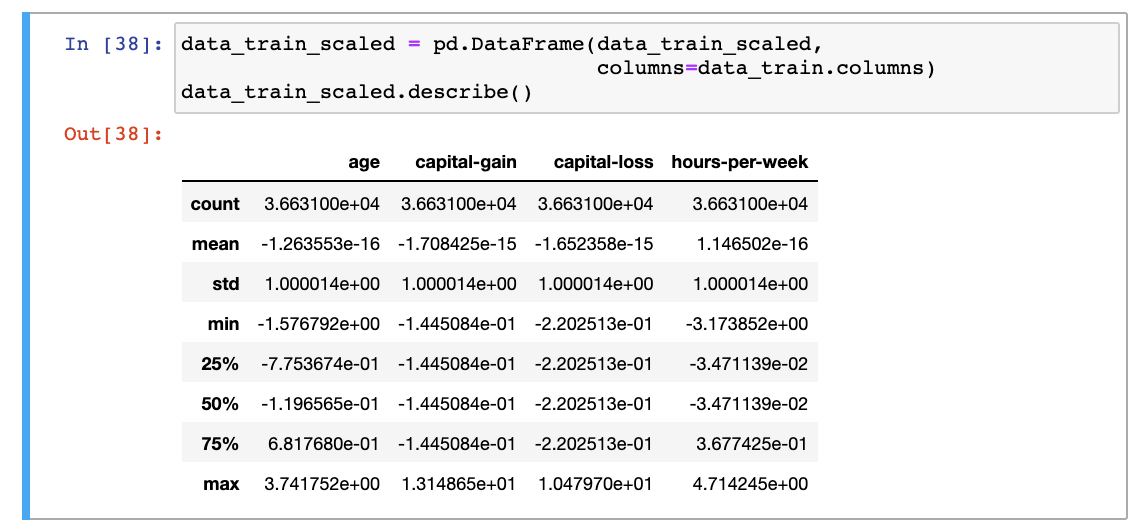
this code data_train_scaled.describe(), shows this:
I wonder why the formatting is different for the different cell codes.
Because we have a mean really close to zero but not being zero for numerical error reason after scaling. So pandas switch to engineering notation to be able to show us the small numbers (e.g. -1.2…e-16)