
How can i make sure that i select test score of 0.85 and above? the plot doesn’t show the selected parameter or metric ranges.
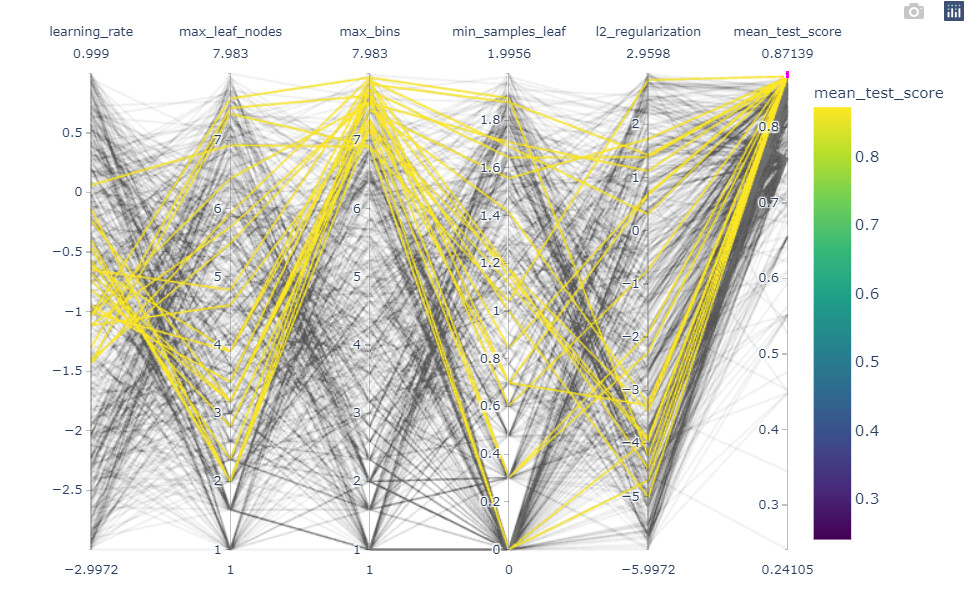
There is no strict way to find it. When we state above 0.85 is to mention to top best performing model and give an idea of where to place the cursor. With your current selection, it should already be good to answer the subsequent questions.
1 Like
Thank you @glemaitre58. Indeed that’s what i did. Just wondered if there is a another way to do it that i am now aware of. Thank you for confirming this!
I used plotly graph_objects with tickvals to display 8.5 tick with below code:
import plotly.graph_objects as go

fig = go.Figure(data=
    go.Parcoords(
        line = dict(color = cv_results["mean_test_score"]),
        dimensions = list([
            dict(
                label = 'Learning rate', values = cv_results['param_classifier__learning_rate']),
            dict(
                label = 'Max leaf nodes', values = cv_results['param_classifier__max_leaf_nodes']),
            dict(
                label = 'Max bins', values = cv_results['param_classifier__max_bins']),
            dict(
                label = 'Min samples Leaf', values = cv_results['param_classifier__min_samples_leaf']),
            dict(
                label = 'L2 regularization', values = cv_results['param_classifier__l2_regularization']),
            dict(
                tickvals = [0.1,0.2, 0.3, 0.4, 0.5, 0.6, 0.7, 0.8, 0.85, 0.9],
                label = 'Mean test score', values = cv_results['mean_test_score']),

        ])
    )
)

fig.update_layout(
    plot_bgcolor = 'white',
    paper_bgcolor = 'white'
)

fig.show()
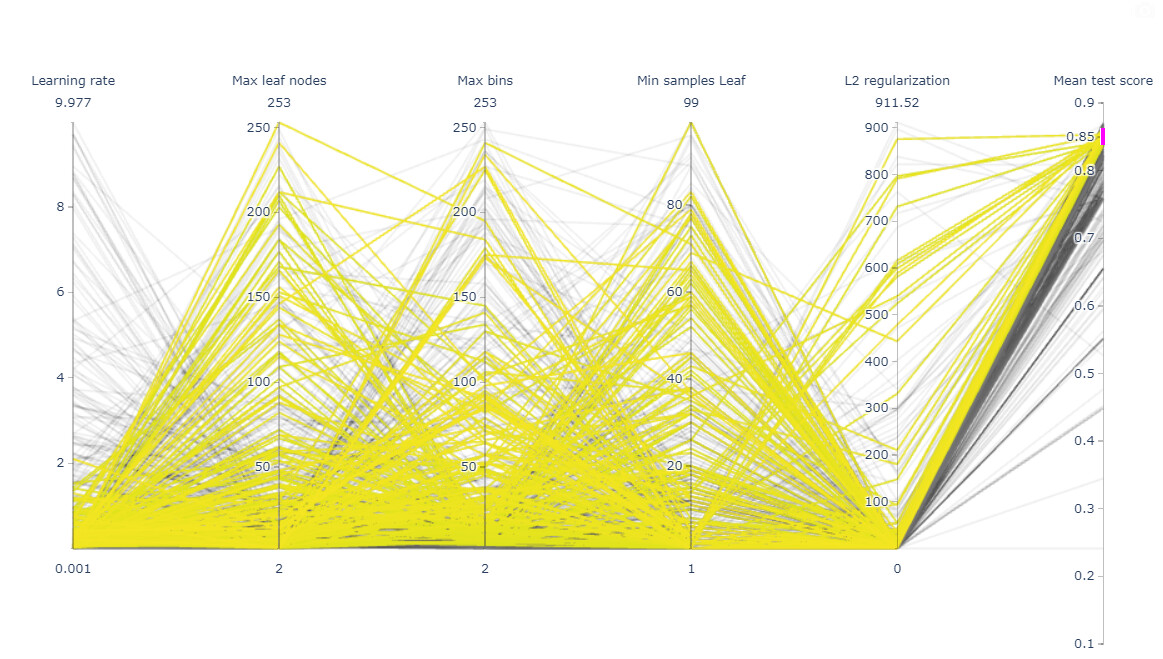
This is a good programmatic solution. You might need to add the log2/log10 space to get the same axis as previously if needed.