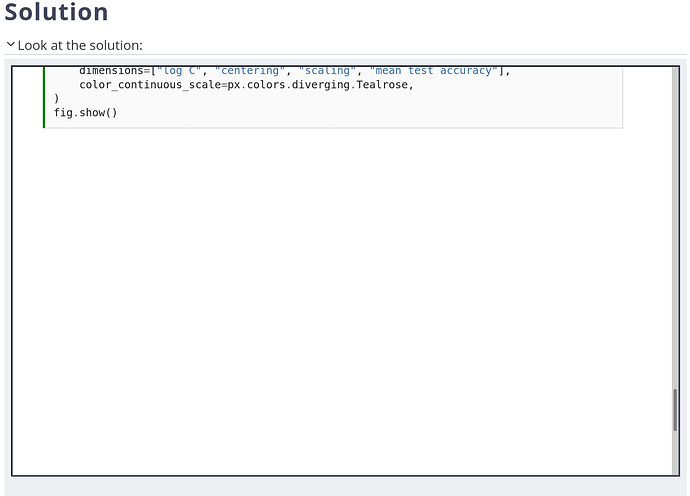
In the solution of M3.02, there is an addendum at the end. Unfortunately, the figure is not showing, at least on my end (maybe it’s working for others). Of course, I ran the code in the sandbox to be able to see it. But maybe, this is worth looking if it’s an overall issue.
Not sure I understand fully, in particular what makes you think there should be a figure in the answer.
Having said that, a figure would indeed be very useful, maybe for the MOOC version 2. There are some technical problems to overcome e.g. in an ideal world we would host the image in our internal repo and I am not sure how FUN can get it.
I changed the solution to make it explicit that executing the code in the notebook is required to display the figure:
I agree it would be a nice to have. How do we track this suggestion for v2? It seems that the current rendering of the solution notebooks that include plotly figures do not work, even when browsed from outside the fun-mooc platform:
https://inria.github.io/scikit-learn-mooc/python_scripts/parameter_tuning_sol_03.html
Edit: we probably just need to edit our config:
https://jupyterbook.org/interactive/interactive.html#plotly
Let me try this here:
Edit 2: it works. The figured is now rendered by jupyterbook directly.
In my case, there is a large empty space after the chunk of code, with a fig.show() at the end (see below or there 📃 Solution for Exercise M3.02 — Scikit-learn course).
I assumed wrongly that this space was likely there for the graph.
I assumed wrongly that this space was likely there for the graph.
Not necessarily wrongly  Let’s see if we can make plotly rendering work on the jupyterbook rendered page.
Sorry I was too quick, there were two things here:
- I thought you were talking about a quiz answer rather than an exercise solution. It could potentially be useful to have plots as part as the answer but that’s not really what you were talking about.
- in the case of an exercise solution it should work so thanks for noticing and reporting it! @ogrisel is very likely right with its fix proposal.
@ogrisel’s fix did the trick thanks for this!
Also I removed the “copy and paste the following code in the notebook” added by @ogrisel above (Missing figure in the solution of ex M3.02 - #3 by ogrisel) in this commit Remove comment now that plotly works in the rendered HTML. · INRIA/scikit-learn-mooc@d79bc3d · GitHub
In my case I had the same issue and solved it by selecting the kernel tab on the top of the notebook and doing restart and run all. This execute the entire code and render the plot.

