
How did you get the figures below, i checked the value counts for each species and the data shape but it didn’t correlate.
adelie_proba = 103 / 161
chinstrap_proba = 52 / 161
gentoo_proba = 6 / 161
Not really sure what you are referring to. I assume this plot:
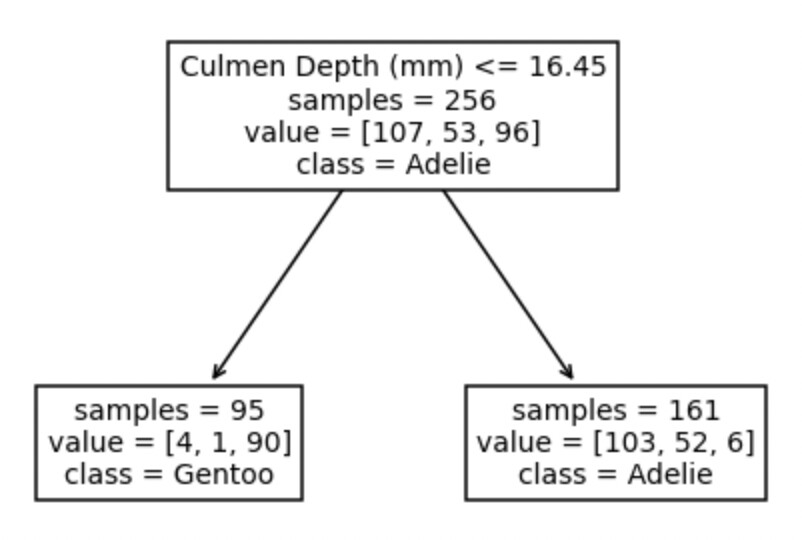
Basically, they are the training examples available in the leaf of the tree once the first split is performed. So if you want to check these values, you need to introspect the tree and not the training data.
It’s still not clear, for eg from the notebook we have chinstrap_proba as 52 / 161. Now from the tree, how was this realised?
samples=161 relates to the total number of samples at the tree.
Then, in values = [103, 52, 6], you have the three classes’ distribution and the second number corresponds to the chinstrap.
One can know the order of the class in a programmatic manner with with tree.classes_.
Thank You. I get it now