
Hi,
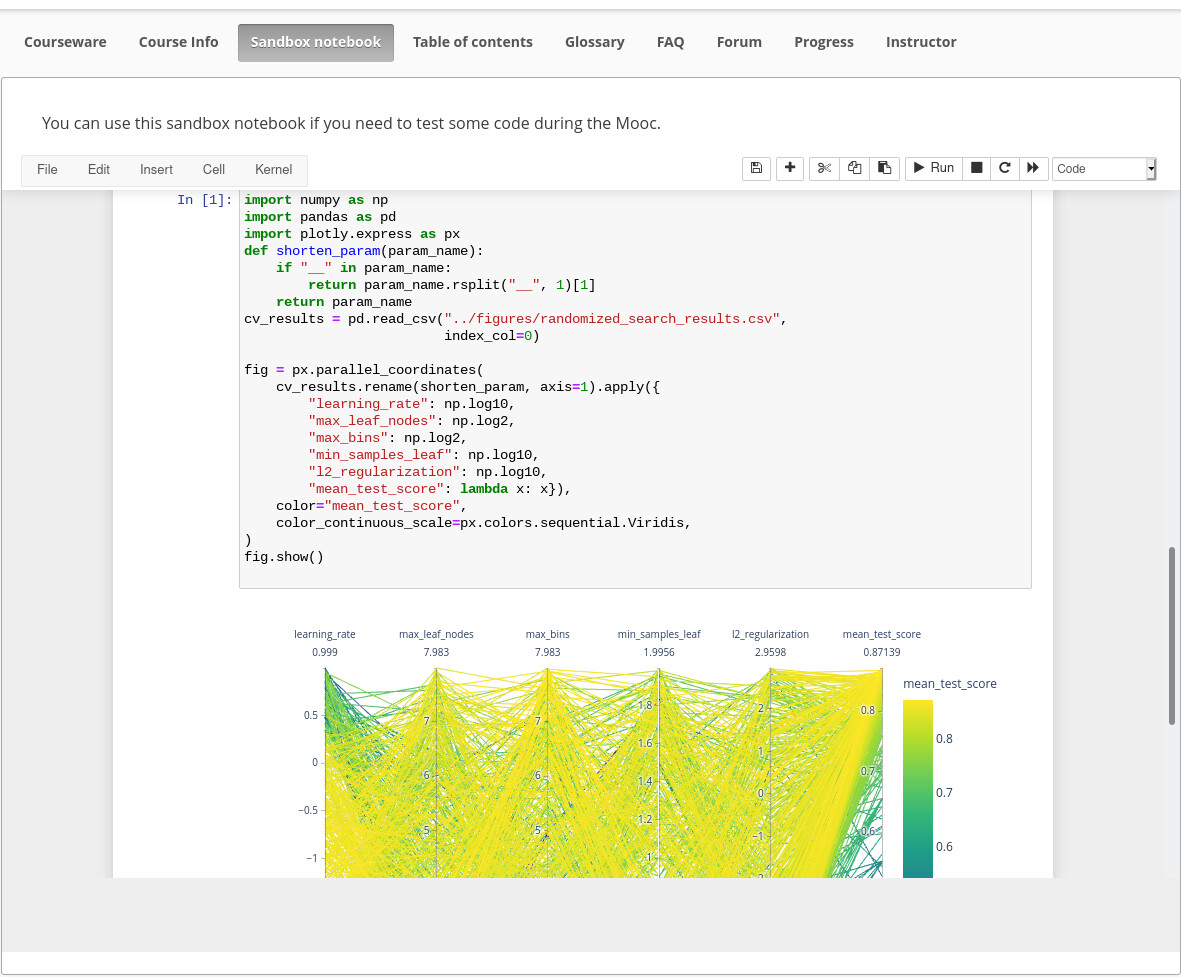
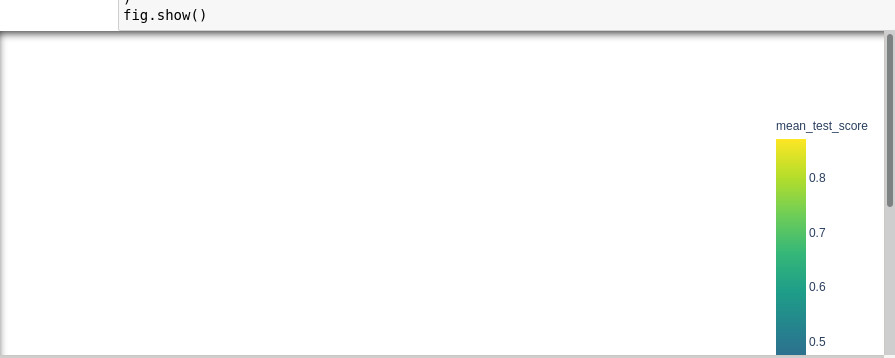
When I execute the code of question 4, I just see a vertical bar for mean_test_score.
Thank’s for your help
Can you post a screenshot?
It should work in you are using the Jupyter notebook hosted inside the FUN MOOC platform. At least it works for me, here is a screenshot from the “Sandbox notebook” where I just double-checked:
If you are running locally, see https://mooc-forums.inria.fr/moocsl/c/faq-on-notebooks/jupyter-local-installation/269.
OK very weird, maybe @brospars can help debugging this one …
Which browser do you use? One semi-random suggestion would be to try a different one and see whether this problem goes away.
Another semi-random thing; it seems that the output cell is somehow collapsed, isn’t it?
 not sure I can tell from the screenshot, what is more likely is that the screenshot does not show the full output cell.
To me the weird thing is that the colorbar is visible (and has the right range) but not the full plot is not visible …
If I wanted to go into wild-guess territory: the Python code worked but the Javascript did not, which is why I was suggesting trying a different browser …
I tried different computers (Windows, Debian buster) with different browsers (Firefox, Opera, Chrome). Sometimes, with the same configuration, I don’t see anything, sometimes I see the color bar. One time I saw the figure after restarting kernel with Windows+Firefox. But now it doesn’t works.
OK this is quite weird … maybe a plotly issue. The only thing I found that is a bit similar with your issue is this: Parallel coordinates plot lines not appearing in Ubuntu 18.04 - Plotly.py - Plotly Community Forum.
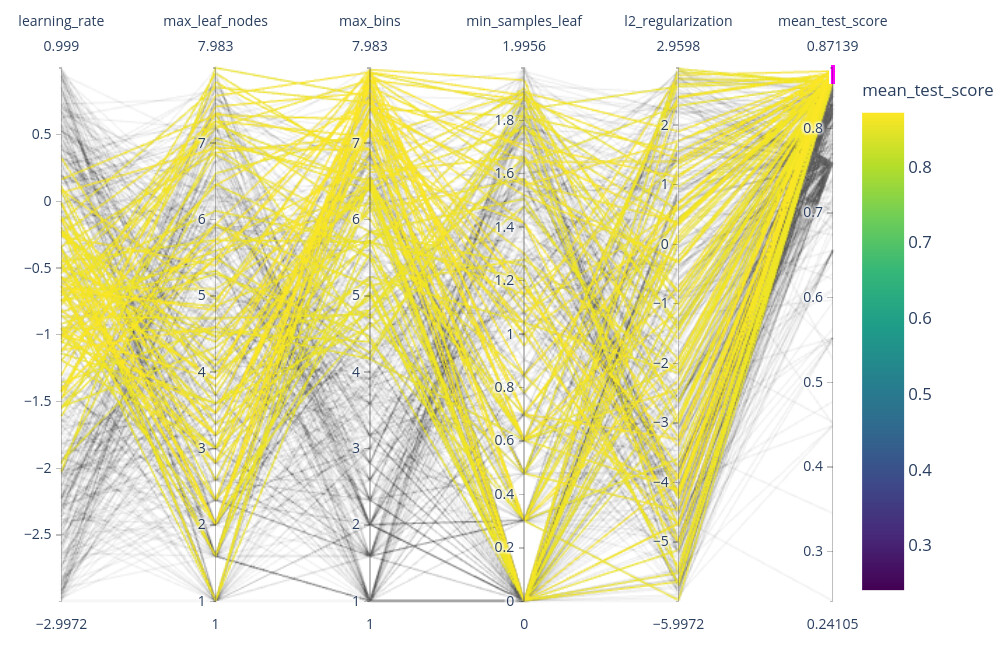
To allow you to answer the questions here are two screenshots on my machine:
model with an accuracy smaller than 0.8:
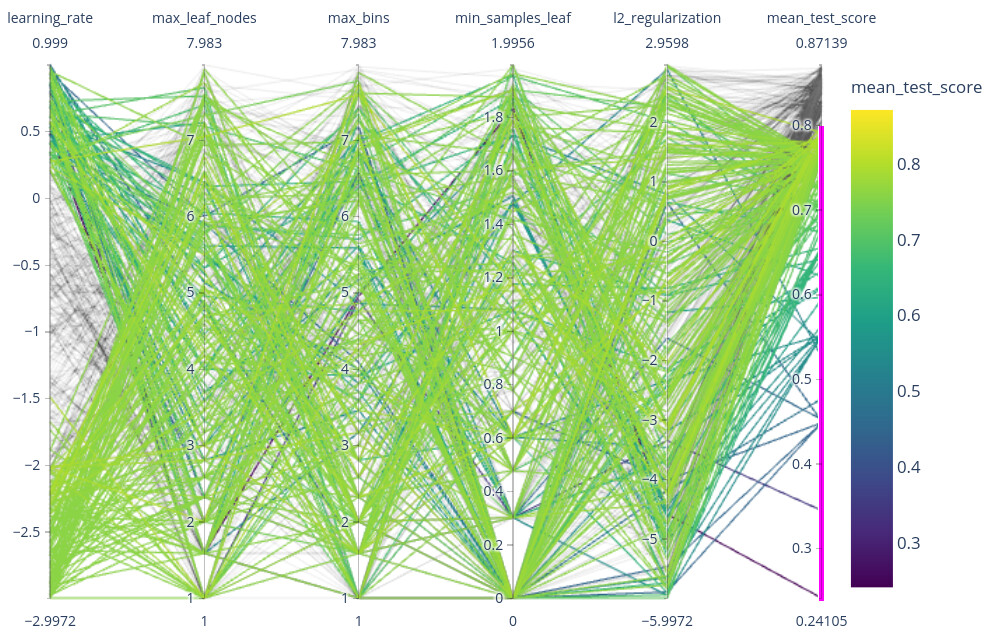
model with an accuracy greater than ~0.85:
1 Like